📊 Full opportunity report: The Art Of AI Data Rendering: Signature Storm Data Without Visual Assets on ThorstenMeyerAI.com — validation score, market gap, and execution plan.

Get everyday essentials delivered free — and shop member deals
- Fast, free delivery on millions of items
- Access to Prime Big Deal Days deals on October 6–7
- Prime Video, Amazon Music and more included
TL;DR
An AI-crafted digital storm chase visualizes supercell development entirely through code, without external media. This showcases a new approach to weather data rendering emphasizing data accuracy and procedural graphics. The project highlights innovations in data visualization and AI-driven design.
An AI-crafted digital storm visualization showcases a supercell’s lifecycle entirely through procedural graphics, built with HTML, CSS, and JavaScript, avoiding external media assets. This innovation emphasizes data accuracy and disciplined visualization, marking a significant step in weather data rendering.
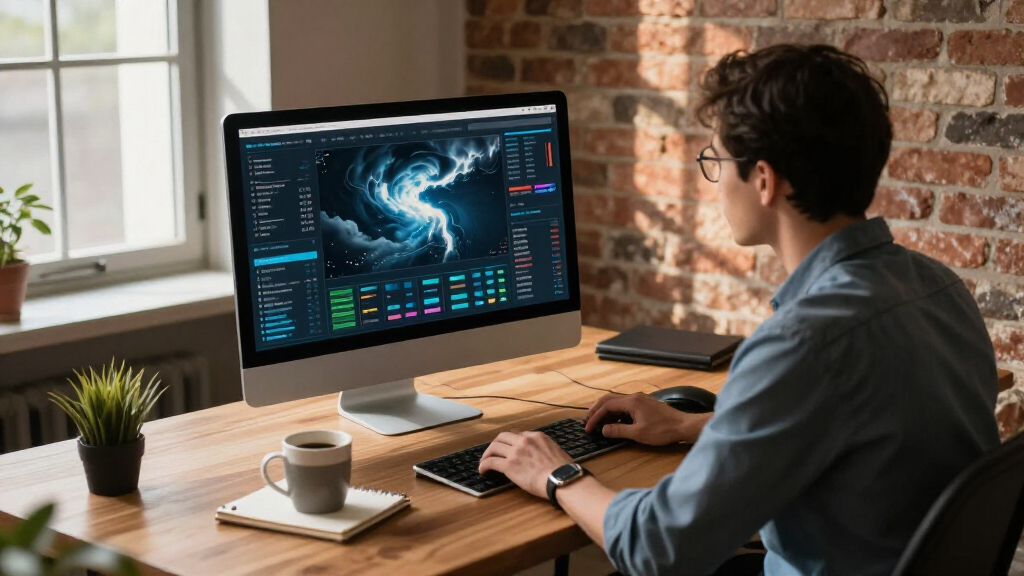
The project, titled Vortex Field Unit — Plains Intercept Archive, is an interactive storm visualization that simulates a storm chase on the Great Plains. It synchronizes multiple visual layers—such as cloud formations, rain curtains, and radar reflectivity—through a unified scroll interaction. All graphics are generated programmatically, ensuring no external images or assets are used. The visualization employs a restrained color palette and specific typography to evoke a stormy atmosphere while maintaining clarity.
Developed using only HTML, CSS, and JavaScript, the system creates a dynamic, layered scene where a supercell’s funnel cloud and radar hook evolve in harmony as the user scrolls. The approach demonstrates how complex weather phenomena can be portrayed with procedural graphics, focusing on data accuracy and visual storytelling. The project is part of a broader exhibition of 175 AI-built websites, each exploring different digital storytelling techniques.
Procedural Weather Systems / Field Note 01
The Art of AI Data Rendering: Signature Storm Data Without Visual Assets
An AI-crafted digital storm chase renders a supercell entirely through code. Cloud structure, rain curtains, radar reflectivity, and funnel evolution become synchronized procedural layers—with no photographs, video, or external visual assets.
The development
A storm assembled as a system
The project, Vortex Field Unit — Plains Intercept Archive, treats weather as coordinated data states rather than a collection of static pictures. Each visual component is generated programmatically and responds to the same narrative position.
Layer 01 / Atmosphere
Cloud formation
Procedural shapes construct the supercell’s mass, rotation, depth, and changing silhouette without bitmap imagery.
Layer 02 / Precipitation
Rain curtains
Density, direction, and opacity produce a moving precipitation field that remains visually tied to storm intensity.
Layer 03 / Radar
Reflectivity hook
A code-rendered radar signature develops alongside the visible storm, keeping atmospheric and analytical views aligned.
Layer 04 / Vortex
Funnel evolution
The funnel changes through defined states, turning storm development into an explainable visual sequence.
Control / Timeline
Scroll synchronization
A unified scroll position advances every layer together, producing a disciplined narrative instead of disconnected animation.
Art direction / Restraint
Visual coherence
A limited palette and deliberate typography evoke the Great Plains while keeping data relationships legible.
Unified rendering model
One signal, multiple visual layers
The central design principle is agreement. A single progression state drives the cloud, rainfall, radar, and vortex views so each layer tells the same meteorological story at the same moment.
Define states
Establish the storm’s visual and meteorological phases.
Bind variables
Connect intensity, form, position, and timing.
Render layers
Generate clouds, rain, radar, and funnel graphics.
Synchronize
Advance every layer from one scroll-driven signal.
Critique
Refine clarity, responsiveness, and visual agreement.
Method comparison
Beyond the traditional weather map
Procedural rendering introduces scalability and interaction, but it does not automatically guarantee scientific validity. The distinction between a coherent demonstration and an operational forecast remains essential.
| Capability | Static imagery | Procedural storm | Operational forecast tool |
|---|---|---|---|
| Generated entirely through code | ✗Typically no | ✓Yes | ~Varies |
| Scroll-synchronized storytelling | ✗Limited | ✓Core feature | ✗Not typical |
| Live weather data integration | ✗No | ~Unconfirmed | ✓Required |
| Controlled visual consistency | ~Moderate | ✓High | ✓High |
| Validated forecasting accuracy | ✗Not applicable | ~Not established | ✓Essential |
| External media dependency | ✗Usually required | ✓None | ~System-dependent |
Legend: ✓ established capability / ✗ absent or unsuitable / ~ variable or unconfirmed
Evidence boundary
Compelling concept, open validation
The project demonstrates disciplined visual coordination inside a controlled environment. It has not yet established real-time accuracy, educational effectiveness, or large-scale operational reliability.
“Complex weather phenomena can be depicted with procedural graphics, emphasizing data accuracy over static imagery.”Anonymous researcher / project commentary
Indicative readiness profile
Where the concept stands
Key questions
What the experiment proves—and what comes next
Its immediate value lies in the rendering method: complex, coordinated scenes can be generated without external assets. Practical adoption will depend on data integration, accessibility, testing, and validation.
How is it different from a traditional map?
It uses fully code-generated layers and scroll-driven progression to show storm evolution, rather than presenting a fixed image or isolated map frame.
Can it support real-time forecasting?
Not yet. The current concept prioritizes internal visual agreement and narrative clarity; live weather-feed integration remains a future direction.
What does it require?
A modern browser supporting HTML, CSS, and JavaScript. The scene itself does not depend on external images, video, or visual media files.
Is it ready for education?
It is promising as a demonstration, but accessibility work, curriculum alignment, scientific review, and learner testing are still needed.
Why is the approach innovative?
Cloud, rain, radar, and funnel states evolve together through a unified interaction, turning code into both the rendering engine and the narrative medium.
What should development address next?
Live data feeds, finer procedural detail, performance testing, responsive behavior, scientific validation, and broader user critique.
Traceability chain
From atmospheric signal to useful understanding
Implications for Weather Data Visualization
This development demonstrates that weather phenomena can be represented accurately and engagingly without relying on static images or external media assets. By using procedural graphics driven by data, it offers a new method for real-time, scalable, and disciplined weather visualization. This approach could influence future weather forecasting tools, educational platforms, and data storytelling, emphasizing clarity, data integrity, and visual coherence.
As an affiliate, we earn on qualifying purchases.
Innovative Use of Procedural Graphics in Digital Storms
The project builds on recent advances in AI and web technologies, showcasing a shift from static imagery to dynamic, code-driven visualizations. Historically, weather visualizations depended heavily on external images or static maps. This initiative pushes toward fully code-generated scenes, emphasizing data consistency and interaction. The development follows a multi-stage process involving responsive design, critique, and art-direction to ensure technical precision and visual impact. It is part of a larger series of AI-created websites exploring new frontiers in digital storytelling and data visualization.
“This approach proves that complex weather phenomena can be depicted with procedural graphics, emphasizing data accuracy over static imagery.”
— an anonymous researcher
As an affiliate, we earn on qualifying purchases.
Unconfirmed Aspects of Data Accuracy and Scalability
It is not yet clear how accurately the procedural graphics reflect real-time weather data or how scalable this approach is for broader applications. The project emphasizes visual storytelling and data agreement within its controlled environment, but its effectiveness for actual forecasting or educational use remains to be validated.
procedural graphics programming books
As an affiliate, we earn on qualifying purchases.
As an affiliate, we earn on qualifying purchases.
Future Directions for Data-Driven Weather Visualizations
Further development may include integrating live weather data feeds, expanding procedural techniques for more detailed phenomena, and testing scalability for broader educational or forecasting platforms. Additional critique and user testing will help determine its practical applications beyond artistic and illustrative purposes. The ongoing series of AI-built websites will continue to explore and refine these techniques.
As an affiliate, we earn on qualifying purchases.
Key Questions
How does this visualization differ from traditional weather maps?
It uses procedural graphics generated entirely by code, avoiding static images or external assets, and synchronizes multiple visual layers through scroll interaction to depict storm evolution.
Can this approach be used for real-time weather forecasting?
Currently, it emphasizes data agreement and visual storytelling rather than real-time data integration, so its use in forecasting remains experimental and unconfirmed.
What are the technical requirements to view this visualization?
It runs on any modern browser supporting HTML, CSS, and JavaScript, with no external assets or dependencies required.
Is this visualization accessible for educational purposes?
While visually compelling, its focus on procedural graphics and data accuracy is primarily demonstrative; further development is needed for full educational integration.
What makes this project innovative compared to previous weather visualizations?
The use of fully code-generated, scroll-synchronized layers that simulate complex weather phenomena without external media assets represents a novel approach in digital visualization.
Source: ThorstenMeyerAI.com
Halloween Picks
halloween
As an affiliate, we earn on qualifying purchases.