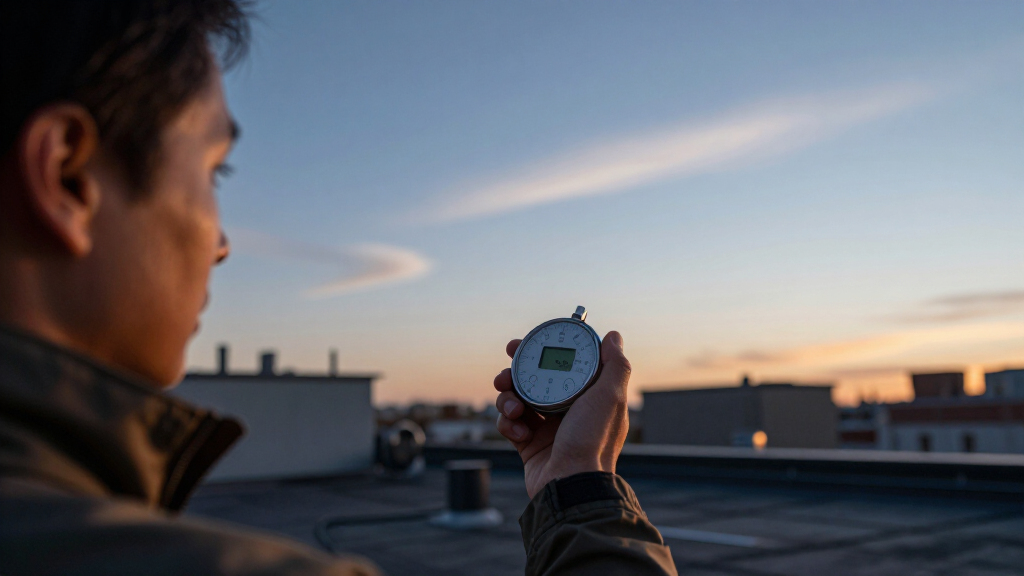

🔍 Read the full analysis: How The Twilight Dial Shapes An AI Noctilucent Cloud Watch on ThorstenMeyerAI.com

Get everyday essentials delivered free with Prime
- Fast, free delivery on millions of items
- Prime Video, Amazon Music and more included
- Member-only deals all year
TL;DR
“Noctilucent — NLC Watch at 83 km” is an AI-built exhibition piece, not a real observing service. Its interactive dial changes the scene’s lighting as the sun moves from 6 to 16 degrees below the horizon, tying the visual experience to real noctilucent-cloud science.
ThorstenMeyerAI.com’s Room 162 of 175, titled “Noctilucent — NLC Watch at 83 km,” presents an AI-built exhibition that lets visitors change a simulated twilight sky with a solar-depression dial, as detailed in the original analysis. The project is a fictional field journal, not a real cloud-monitoring service, but its central subject—high-altitude noctilucent clouds—is real.
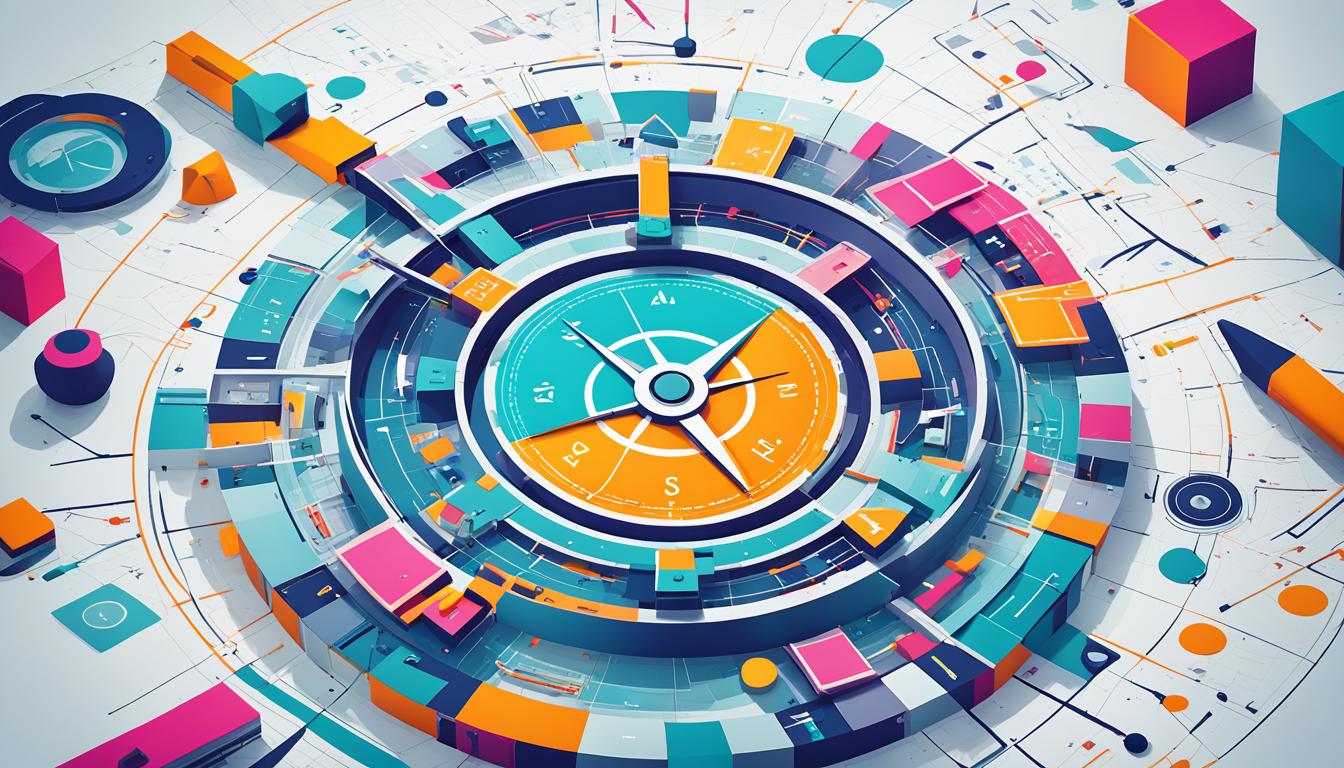
The dial ranges from the sun 6 to 16 degrees below the horizon, with the exhibit’s most expressive lighting near 11 degrees. As visitors move it, multiple parts of the scene change together: sky brightness, shadow depth, cloud glow, ambient color, grain and the flare along the horizon. Supporting diagrams and text also follow the selected state, making the dial an organizing feature rather than a standalone visual effect.
The page’s sky and cloud forms are generated in the browser using Canvas, inline SVG and CSS; the source says it uses no image assets. Different cloud forms receive different motion: billows repeat in close crests, whirls bend into polar-like distortions, and bands move in broader waves. The interface also includes a hold-to-reveal exercise: ground-level haze recedes while a cloud band at 83 kilometres becomes clearer. Releasing the control early lets the simulated sighting fade.
The exhibition moves from the horizon and cloud forms through ice crystals and seasonal observation, ending in a cream-colored field-log section. The palette contrasts electric cyan for illuminated ice with violet and near-black for the night sky. The source also describes reduced-motion behavior and animation that pauses when the page is hidden or its scenes are offscreen.
Room 162 of 175 · Interactive exhibition
How The Twilight Dial Shapes An AI Noctilucent Cloud Watch
A solar-depression dial turns a fictional field journal into an atmospheric study: one changing twilight value reshapes the whole scene around clouds set at 83 kilometres.
01 / One control, connected effects
A dial that changes the whole sky
The central design idea is to link a meaningful scientific variable—the Sun’s position below the horizon—to several visible effects at once. Visitors can explore a simulated twilight scene rather than looking at a fixed illustration.
Solar depression · illustrative range
The exhibit describes its most expressive lighting near 11 degrees. The marker above is a graphic guide, not a live reading.
02 / Procedural atmosphere
Motion gives each cloud form its own character
The project description says the sky and cloud forms are generated in the browser, without image assets. Different shapes receive different motion rather than sharing one repeated animation.
01 · Repeating
Close crests
Billowing forms repeat in tight, near crests, suggesting clustered texture across the cloud field.
02 · Distorting
Polar-like whirls
Whirls bend into distortions, lending the scene a changing, almost polar atmosphere.
03 · Sweeping
Broad bands
Longer cloud bands move in wider waves, creating a slower sense of scale and drift.
Patience becomes part of the interface.
A hold-to-reveal moment makes waiting visible: haze recedes, the high cloud band emerges, and an early release lets the simulated sighting fade.
Hold to reveal
The visitor sustains the interaction as ground-level haze gradually recedes.
Look higher
A cloud band at the exhibit’s stated 83-kilometre altitude becomes clearer.
Release early
The simulated sighting fades, reinforcing the experience’s focus on patience.
03 / Science and story
Real clouds, fictional field notes
Noctilucent clouds are real high-altitude ice clouds. They can remain illuminated by the Sun after the ground below has entered darkness. The exhibit uses this real phenomenon as the basis for an imagined observing project.
Atmospheric science
What is real
Noctilucent clouds, their high-altitude ice, and the twilight contrast that makes them visible are real. The exhibit places its cloud band at 83 km as part of its design brief.
Exhibition fiction
What is invented
The watch network, observer stations, logs and calendar are fictional. The dial is a designed visualization, not a source of live measurements or forecasts.
“Make one meaningful variable influence the whole experience.”ThorstenMeyerAI.com · Design principle
04 / What the source establishes
A designed experience, not an observing service
Traceability / The exhibit’s visual journey
From horizon to field log
The exhibition moves from sky and cloud forms into the science and seasonal framing, then closes on a cream-colored field-log section.
Key questions
Quick answers for readers
Is NLC Watch a real monitoring service?
No. It is described as an AI-built exhibition and fictional field journal, not a live scientific service or observing network.
What does the twilight dial control?
It represents the Sun from 6 to 16 degrees below the horizon. The simulated sky, cloud glow, shadows, ambient color and related diagrams and text respond.
Are noctilucent clouds real?
Yes. These high-altitude ice clouds can remain sunlit after the ground below has entered darkness. The exhibit’s watch project and field logs are fictional.
How are the visuals made?
The project description names browser-generated Canvas, inline SVG and CSS visuals, with no image assets.
Does it show live observations?
No live data is identified. The dial is part of a designed visualization, not a measurement tool.
What is the useful takeaway?
One meaningful variable can shape an entire visual experience, helping visitors explore how a concept connects across a scene.
A Dial That Changes the Whole Sky
The design’s main idea is to connect a familiar scientific variable—the sun’s position below the horizon—to several visible effects at once. That gives visitors a way to explore the relationship between twilight and cloud visibility, rather than simply reading about it or viewing a fixed illustration. The source describes the visual model and interface, but does not report user testing or evidence that the exhibit improves scientific understanding.
The distinction between a fictional watch project and real atmospheric science matters. The page is not reporting live sightings, measurements or forecasts. Its value is as an interactive explanation and art-directed demonstration: it makes the contrast between a dark observer’s sky and sunlit high-altitude ice the focus of the experience.
As an affiliate, we earn on qualifying purchases.
Real Clouds, Fictional Field Notes
Noctilucent clouds are high-altitude ice clouds that can remain illuminated by the sun after the ground has entered darkness. The exhibit places its cloud band at 83 kilometres and uses the solar-depression control to represent how twilight conditions alter the scene. That figure and the dial’s range are elements of the project’s design brief; the source does not present them as live measurements from an observing site.
The fictional setup includes invented observer stations and an observation calendar centered on summer conditions, but the published description does not identify real observers or an operational network. ThorstenMeyerAI.com frames the room as one installment in a larger series and says the construction guide documents the lighting model, procedural graphics, and visibility-aware animation.
““Noctilucent — NLC Watch at 83 km” is an AI-built exhibition piece: a fictional field journal for a fictional observing project, not a real company or live scientific service.”
— ThorstenMeyerAI.com, describing Room 162
As an affiliate, we earn on qualifying purchases.
No Live Observations Are Reported
The source describes the exhibit’s intended behavior and implementation, but does not provide independent testing results, visitor numbers, or evidence that the page is operating as a scientific instrument. It also does not supply a publication date, a direct account of the build process beyond the stated three-pass workflow, or information about how the work was evaluated.
The stations, observer logs and watch network are fictional elements. No live data feed, cloud sighting, forecast, or real observing organization is identified. The dial should be read as an interactive visualization, not as a measurement tool.
As an affiliate, we earn on qualifying purchases.
The Design Guide and Live Room
ThorstenMeyerAI.com points readers to the live room and an accompanying design guide for further details on the implementation. The guide is described as covering the lighting model, procedural graphics, animation that responds to page visibility, and reduced-motion handling. The source does not announce a later release, scientific validation, or expansion into an operational monitoring service.
For readers exploring the project, the next step is to try the dial and compare how its connected visual elements respond across the stated twilight range, while keeping in mind that the experience is an AI-built fictional exhibition, not an observing network.
high altitude cloud simulation kit
As an affiliate, we earn on qualifying purchases.
As an affiliate, we earn on qualifying purchases.
Key Questions
Is NLC Watch a real cloud-monitoring service?
No. ThorstenMeyerAI.com describes it as an AI-built exhibition and fictional field journal, not a live scientific service or real observing network.
What does the twilight dial control?
It represents the sun between 6 and 16 degrees below the horizon. Moving it changes the simulated sky, cloud glow, shadows, ambient color and related diagrams and text.
Are noctilucent clouds real?
Yes. The source describes them as high-altitude ice clouds that can remain sunlit after the ground below has fallen into darkness. The exhibit’s watch project and field logs, however, are fictional.
How are the exhibit’s visuals made?
The project description says the visuals are generated in the browser with Canvas, inline SVG and CSS, without image assets.
Does the page show live sightings or measurements?
No live data is identified in the source. The dial is part of a designed visualization, and the stated stations and observer logs are invented.
Source: ThorstenMeyerAI.com
Halloween Picks
halloween
As an affiliate, we earn on qualifying purchases.